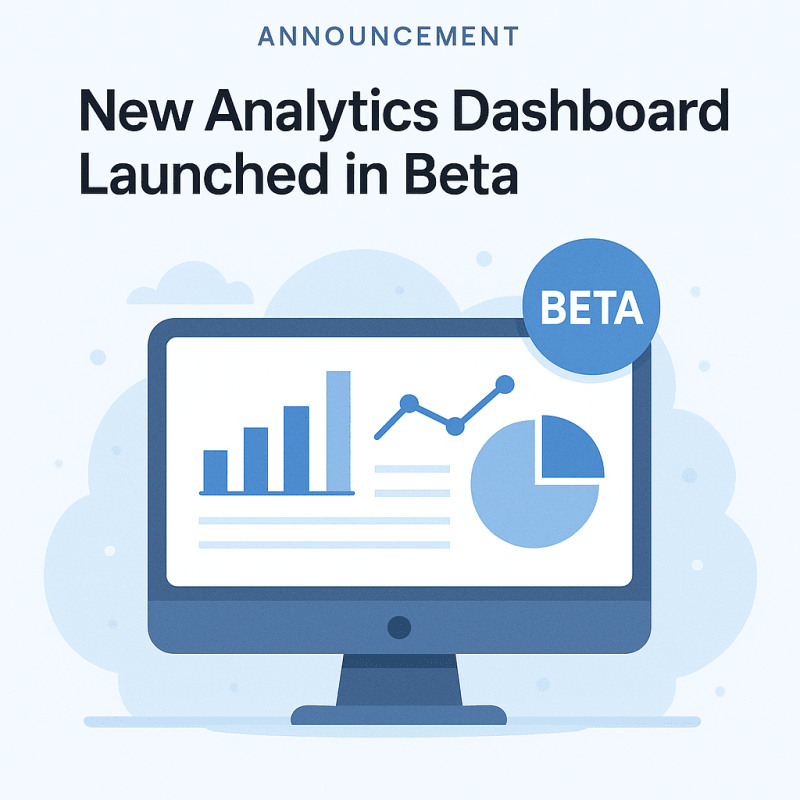
We’re opening the doors to the SaviTap Analytics Dashboard, a faster, more flexible way to explore your cloud and AI spend. Teams have told us they want fewer spreadsheets, more interactivity, and recommendations that show up at the moment of insight. This beta is our first big step toward that vision.
What’s in the beta
- Interactive drilldowns: Slice costs by provider, service, team, environment, or tag, then pivot by date range or resource.
- Benchmarking: Compare against anonymized industry peers to understand whether a spike is normal or a true outlier.
- Outcome metrics: Track cost per order, ticket, session, or other KPIs that map to customer value, not just raw tokens or requests.
- One-click exports: Send charts to Slack or export data to your BI stack for deeper analysis.
Made for velocity
We’ve tuned the query engine for speed—large datasets shouldn’t mean slow answers. The dashboard caches intelligently, surfaces anomalies early, and suggests next steps so you can fix issues, not just observe them.
Road to GA
The beta period will focus on customization (calculated fields, custom dimensions), performance at scale, and tighter integrations with AWS, GCP, Azure, and AI billing APIs. We’re targeting general availability in early 2026, with updates shipping continuously along the way.
Join the beta
Current customers can enable the feature under Settings → Labs. New to SaviTap? Sign up, connect a provider, and try the dashboard on your own data. Your feedback will directly shape what we build next.